


Is BlackRock really buying up all of the single-family homes in America? How involved is Blackstone? Are private equity firms and big investors taking over the housing market? Are “build-to-rent” communities becoming a trend? Are foreigners buying up U.S. residential properties? Who owns all of the vacation rentals, manufactured home communities, and student housing? Are we really going to own nothing and be happy?
Whether you are looking to buy, sell, rent, invest, relocate, or just want to keep your eye on the ball, this report will act as a roadmap, showing where individuals, mom-and-pop investors and large investors monopolize different sectors of the housing industry and where the hot locations are. It is packed with hundreds of statistics and charts to provide both context and visual aids for a comprehensive view of how the landscape of America is shifting. There have been some big misconceptions and many of these statistics will surprise people.
The Complete Roadmap:
• Single-Family Homes and The Rental Market: Homeowners Versus Investors
• The Top 6 Companies That Own Single-Family Home Rentals
• Build-To-Rent Single-Family Home Communities
• Foreign-Owned U.S. Residential Property
• Manufactured Housing Communities
• Vacation Rental Homes Market
• Student Housing Market
• The Affordable Housing Scheme
• Private Equity and Large Investors
• The Biggest Takeaways
Increased mortgage rates that have reached as high as 7.79%, coupled with increased homeowners insurance, property taxes, utility bills, and the darn silverware in the kitchen drawers, has made it extremely difficult for people to afford homes. One of the bigger trends is build-to-rent communities. In fact, many private equity firms, real estate management companies and developers have been selling off inventory of single-family homes while the market has been hot and using the capital to expand on these communities. But make no mistake, there is also a growing trend of buying homes for cash and converting them to rentals. Is it the mega investors, the mom-and-pops or the small-to medium-sized management companies, and where do the shareholders fit into this action?
It’s important to cut through the fog and get down to specifics while comparing homeowners versus small investors, flippers, and mega investors to see where this housing market sits and where it’s headed. The reality is that individual homeowners own the majority of the single-family market and there are a lot of data points that will surprise people. There is also opportunity for individuals and mom-and-pop investors. However, private equity firms pretty much have their claws dug in to every sector of the housing industry from single-family homes to manufactured housing communities and student housing.
There are numbers flying all over the place and it’s not an apples-to-apples comparison by any means because numerous sources use mixed terms without specifying precisely the type of dwelling the numbers represent. Oftentimes, the percentages for investors’ stakes are reduced by lumping data on specific dwellings into the overall housing units market. In addition to this, certain data is only available up to 2022, where other data is current through first quarter 2024. Another big hiccup is that there is no universal definition of “institutional investor,” so multiple data sources will state numbers and percentages based on what they deem to be an institutional investor. For example, some break it up based on 1-10 homes being a small investor and mega investors own more than 1,000, while others will report numbers based on large investors owning more than 100 homes. And, there are also short-term and long-term investors, which obviously makes a huge difference in the grand scheme of things. Furthermore, most don’t dig deep enough to get a realistic picture of who the actual owners are. The data is inconsistent across the board, so comparisons and scrutiny are necessary when pulling data points.
After doing an immense amount of cross referencing, digging into dozens of data points, and running the math to get to the bottom of the actual numbers, this report reveals where homeowners, small investors and mega investors stand in the entire U.S. housing market.
Definitions for clarity:
• Single-Family Homes: include fully detached homes and semi-detached which are side-by-side dwellings making up row houses, duplexes, quadruplexes, and townhouses. If there are units above or below, they are not separate by a ground-to-roof wall, or they have shared meters for utilities they are considered multifamily.
• Multifamily Units: residential buildings containing units built one on top of another and those built side-by-side which do not have a ground-to-roof wall and/or have common facilities such as attic, basement, plumbing, etc. Townhouses and condominiums that do not meet the definition of single-family homes fall under multifamily. Typically, multifamily buildings consist of 5 units or more, but a single structure with 2-4 units can also be considered multifamily if it meets the criteria. Example: of the 450,000 completed multifamily units in 2023, only 12,000 were 2-4 units, 206,000 made up 5-49 units and 233,000 were buildings with over 50 units, with the largest volume built in the South.
• Housing Units: include all single-family detached and semi-detached homes, all multifamily such as apartments, a group of rooms, condos, prefabricated and modular units, mobile homes, and units in assisted living facilities. Excluded from statistics are: dormitories and rooming housing, barracks, transient hotels unless permanent resident, and nursing homes.
Single-Family Homes and The Rental Market: Homeowners Versus Investors
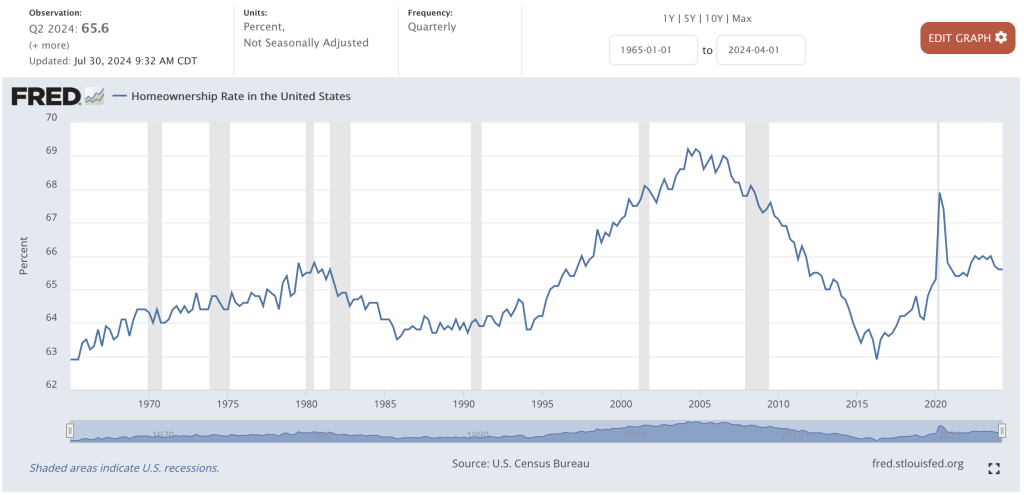
Homeownership rate has toggled between 62.9% and 69.2% from 1965 to April 30, 2024 where it sits at 65.6%.
As of 2022, 39.28% of homeowners own their homes outright and do not carry a mortgage, which is a 6.5% increase since 2010. Again, nearly 40% of homeowners own their homes outright and are mortgage-free! 38% of all homeowners are baby boomers so many have probably lived in their homes for a long time and paid off their mortgage, and some “homeowners” are investors who often don’t carry a mortgage. Nonetheless, it’s an impressive percentage.
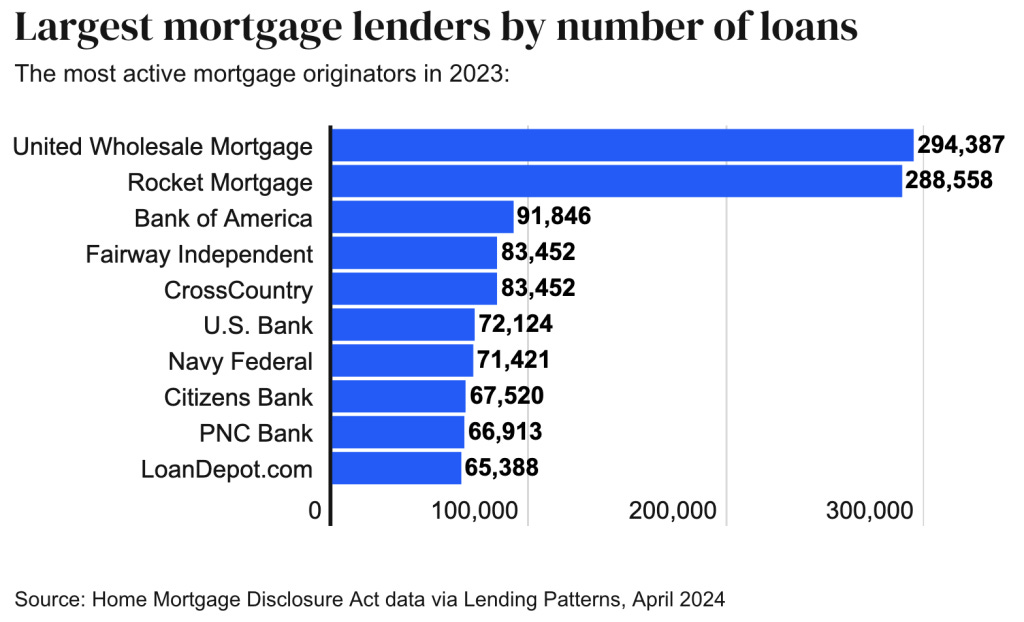
For those who don’t own their homes outright, the largest mortgage originators by number of loans as of 2023 are United Wholesale Mortgage, Rocket Mortgage, Bank of America, Fairway Independent, CrossCountry, U.S. Bank, Navy Federal, Citizens Bank, PNC Bank, and LoanDepot.
Who are the top shareholders of the top three largest mortgage lenders in the U.S.?
The top shareholders of United Wholesale Mortgage (UWM Holdings Corp) are Vanguard, Fidelity, Platinum Equity Advisors, BlackRock, and Northern Trust Corp.
The top shareholders of Rocket Mortgage (Rocket Companies, Inc.) are Vanguard, Fidelity, Boston Partners, JP Morgan Chase & Co, and BlackRock.
The top shareholders of Bank of America are Berkshire Hathaway, Vanguard, BlackRock, State Street Corp, and Fidelity.
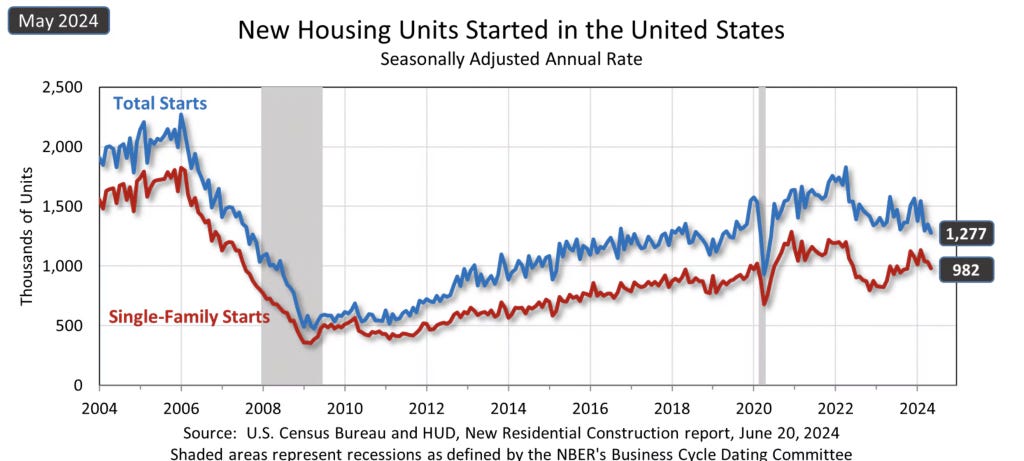
New housing builds have been on a steady increase since 2010, with a slight dip in 2022-2023. On average, there are close to 1.5 million house starts annually, with roughly 65% accounting for single-family homes.
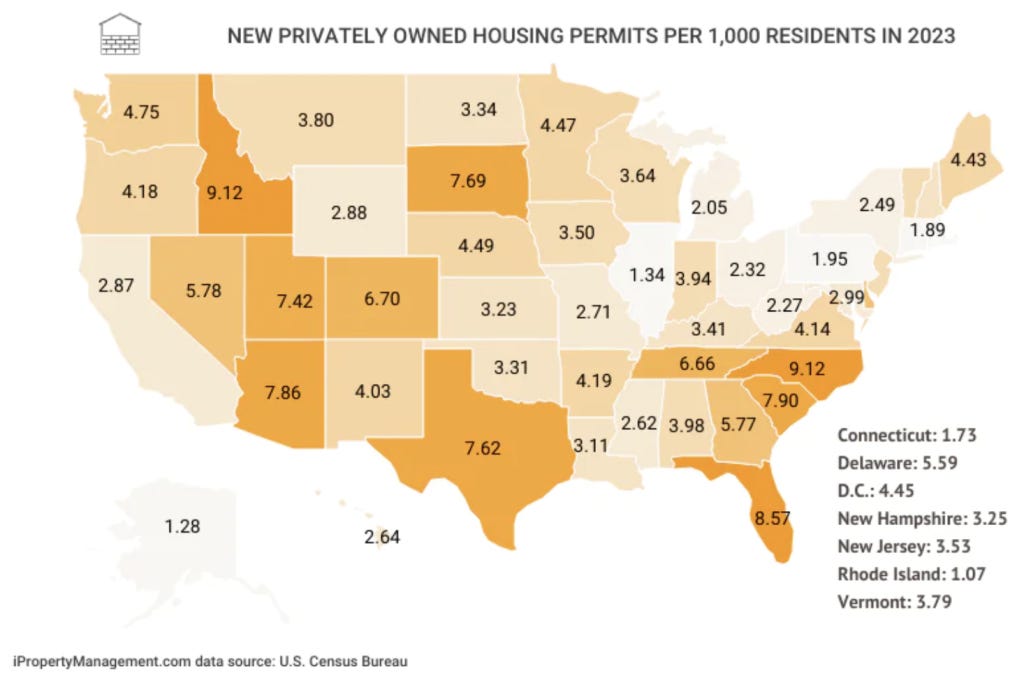
In 2023, North Carolina had the largest number of privately owned housing permits per 1,000 residents, while Idaho, Florida, Arizona, South Dakota, and Texas saw good activity as well.
According to a May, 2024 release by the U.S. Census Bureau, Population Division on annual estimates of housing units for the United States, Regions, States, and the District of Columbia, there were 145.4 million housing units in the U.S., which was updated to 146.6 million in Q2 2024.
U.S. Housing:
Housing Units: 146,640,000
Occupied: 131,414,000
Owner occupied: 86,259,000
Renter occupied: 45,155,000
Vacant: 15,227,000
Approximate Housing Inventory:
90 million single-family detached homes
9 million single-family attached homes
23 million apartment units – 39% are 2-bedroom units & 87.2% of new apts. are built with 20+ units
17 million duplex, condos, townhomes and other multifamily units that consist of 2-9 unit structures
8 million manufactured and mobile homes
Vacancy Breakdown:
11,776,00 year-round – 3,451,000 seasonal
Over 8 million are single-family attached and detached
Over 5 million are apartments
Over 1 million are manufactured and mobile homes
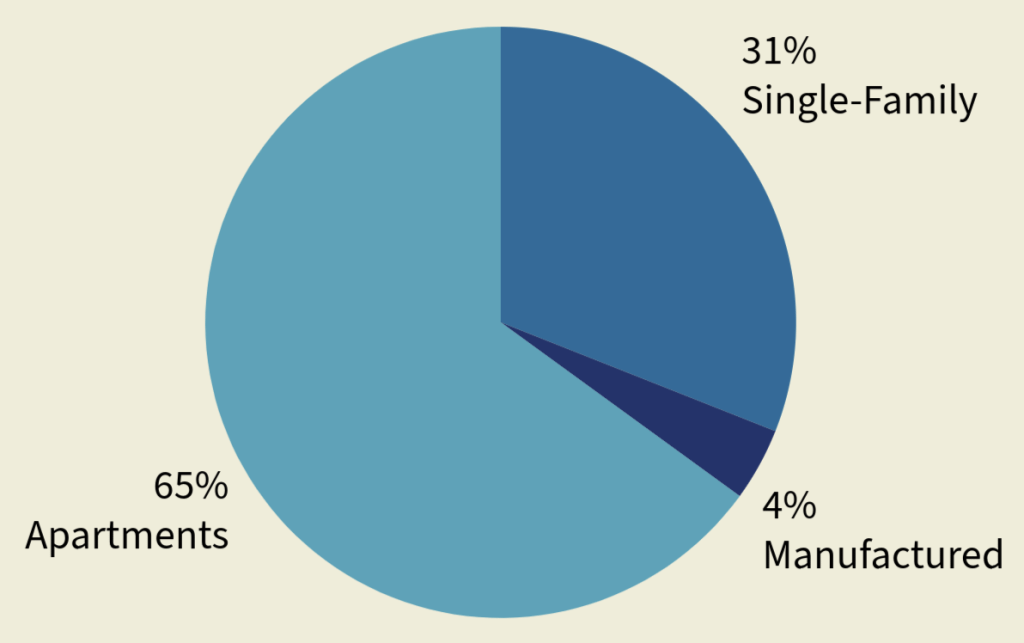
Rental Housing Share from 2023 figures:
65% (29 million) apartments in multifamily buildings
31% (14 million) single-family attached and detached homes
4% (2 million) manufactured and mobile homes
So who owns all of the single-family homes?
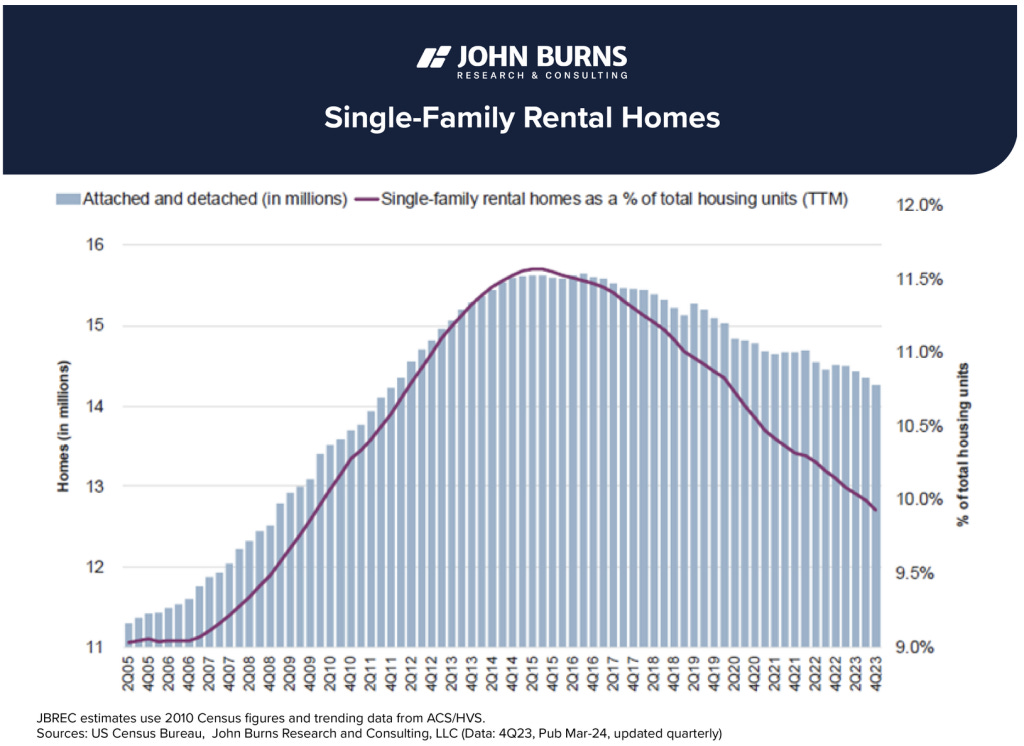
According to John Burns Research & Consulting, investors (including second-home buyers) own 14.3 million single-family rental homes of which 11.4 million are detached and 2.9 million are attached. Based on the 99 million figure pulled from the Census Bureau, that would account for 14.4% of the single-family housing market. However, John Burns’ chart indicates 9.9% to represent the percentage of single-family rental homes owned by investors from the overall housing unit stock in the U.S.
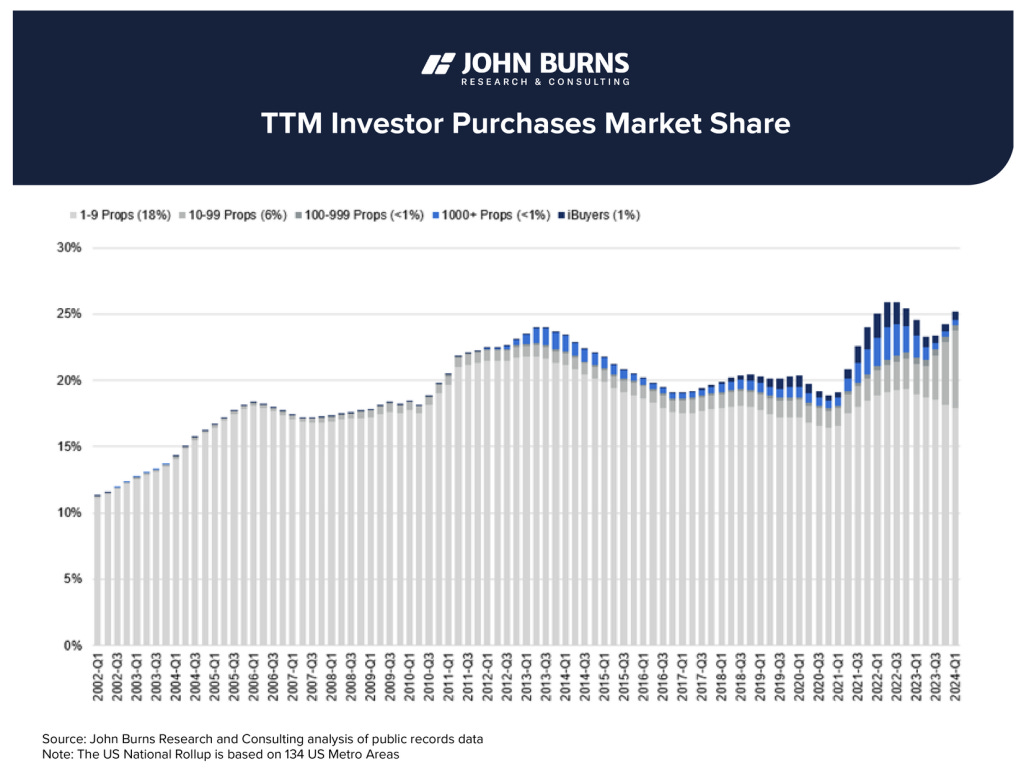
Burns’ data shows that investors are purchasing 25% of homes, which includes second-home buyers. The following chart illustrates that the largest sector of investors are the smaller mom-and-pops who own between 1-9 homes making up nearly 18%, followed by the investors with portfolios of 10-99 units who account for roughly 5%. Big institutional investors who own 100 or more homes are buying less than 2% of all homes. Many of the bigger investors are invested in the build-to-rent single-family home communities, as documented further down.
According to the National Association of Home Builders, the nation’s stock of second homes was at 6.5 million in 2022. Some of those folks rent their second home out, and therefore fall under the mom-and-pop category of the 14.3 million investors who own and rent single-family homes.
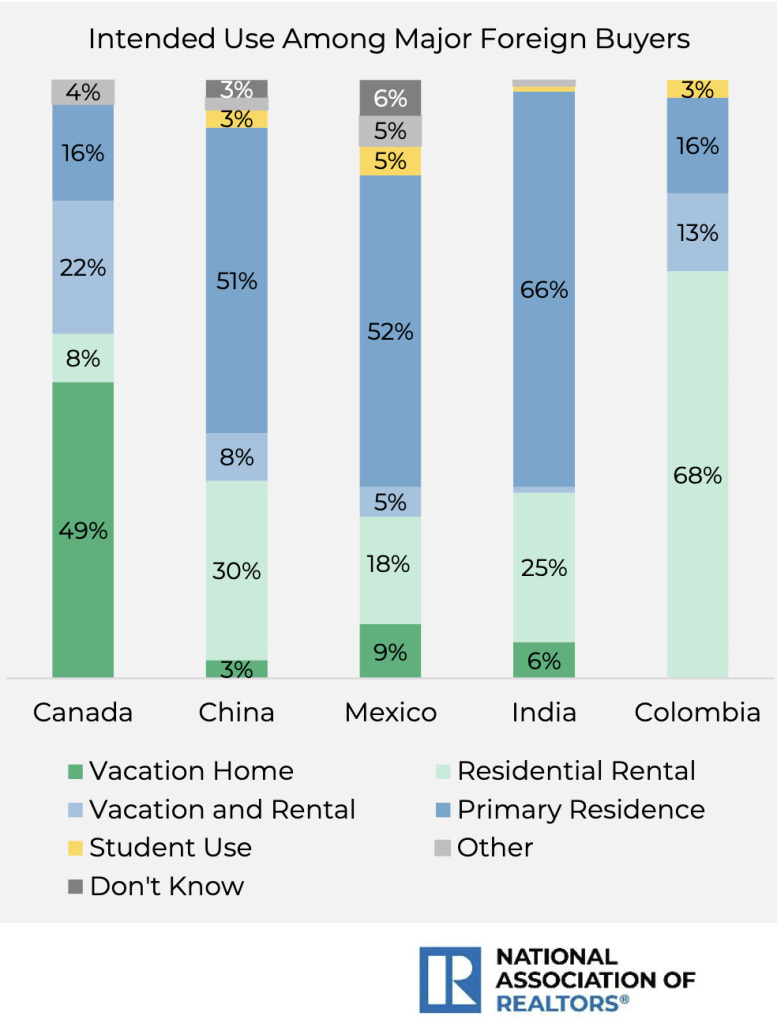
It’s also important to note that foreigners would also calculate into the single-family rental homes. Between April 2023 and March 2024, foreigners purchased 54,300 housing units in the U.S., of which 76% were a detached single-family home or townhome, the median purchase price was $475,000, and 45% use the property for a vacation home, rental, or both. The chart below just represents the top five foreign buyers. See the housing section further down for more details on foreign buyers of U.S. residential property.
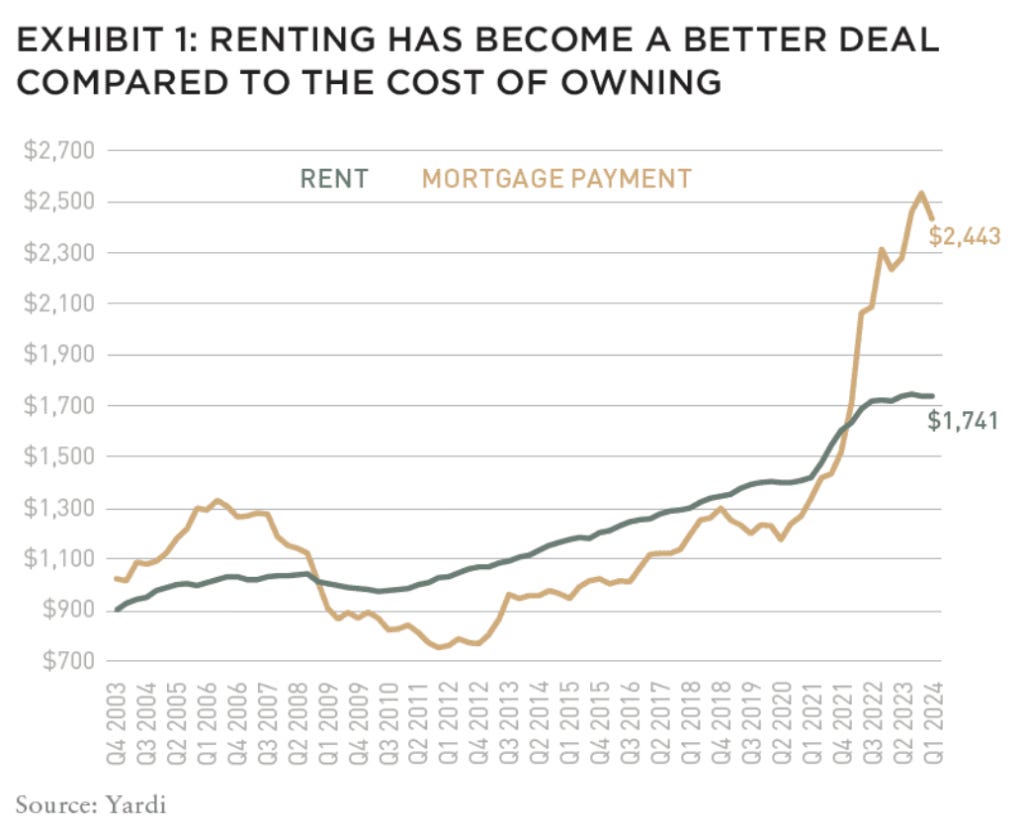
According to Yardi-Matrix, In July 2024, they indicated that the large investors owning over 100 single-family rental homes owned roughly 800,000 – less than 5% of all SFRs. Some other highlights Yardi reported on were that 163,000 units were in communities with fifty or more homes as of March 2024, the occupancy rate of SFR communities was higher than multifamily at 95.4% nationally, and that renting has become more affordable than a mortgage.
• In an Urban Institute report, as of June 2022, there were 46.6 million total rental properties with 15.1 million being one-unit properties (single-family) accounting for 32.4% of the total rental stock. They suggest that the total institutional investor ownership (those owning at least 100 single-family homes) owned 3.8% of the one-unit rentals nationwide. That makes sense since there was a big buying period and then many investors sold off homes when the price was right and invested in the build-to-rent sector.
• According to a 2024 first quarter home sales report by Realtor.com, investors accounted for 14.8% of home purchases, whereby 62.6% of those purchases were made by small investors (10 or fewer homes). Realtor reports that this is the highest small investor share since 2001 when they first began tracking the sales. The large percentages being thrown around in media on investor-owned homes, are percentages of “home sales” for a specific quarter, year, or geographic location, such as this report by Realtor, not the percentage of all single-family homes owned by investors. It’s also important to note that the word “investor” represents single individuals who purchase second homes as well. As one can see in this Realtor report, 62.6% of the 14.8% “investor purchases” were small investors who purchased between 1-9 homes, meaning just 5.5% of homes were purchased by investors who own 10+ homes, and many of those are likely homes that are being flipped, not rented.
• Single-family housing currently makes up 75% of land that is zoned for housing, but many local and state governments have been working on changing zoning laws to allow for smaller housing and multifamily housing to consume portions of that land. They are also aiming to create affordable housing developments. The National Association of Home Builders’ 10-point housing plan includes overturning local zoning rules, removing permitting roadblocks, relief from environmental and community review requirements, and to pass federal tax legislation that will help expand affordable housing.
• In the multifamily sector, such as apartments, the numbers on ownership are a bit fuzzy. There are currently 45.1 million total rental units in the U.S based on the Q2 2024 Census data, of which roughly 30-31 million would represent multifamily. According to the National Rental Home Council, institutional investors owned 55% of multifamily rental units as of 2018. Fast forward to May 2022, and Savills reported that the institutional investors accounted for 40%. In the apartment arena, Greystar has taken the lead over MAA in owning and/or managing more than one million units in the U.S. In 2023, the top five largest apartment owners were MAA, Greystar, Morgan Properties, AvalonBay Communities, and Equity Residential, with three of the five supported by BlackRock and Vanguard. Here is the full 2023 list of the top 50.
Multifamily unit starts have declined the first half of 2024 from much higher levels in 2022-2023. See Fannie Mae’s full 2024 report on the multifamily construction pipeline update.
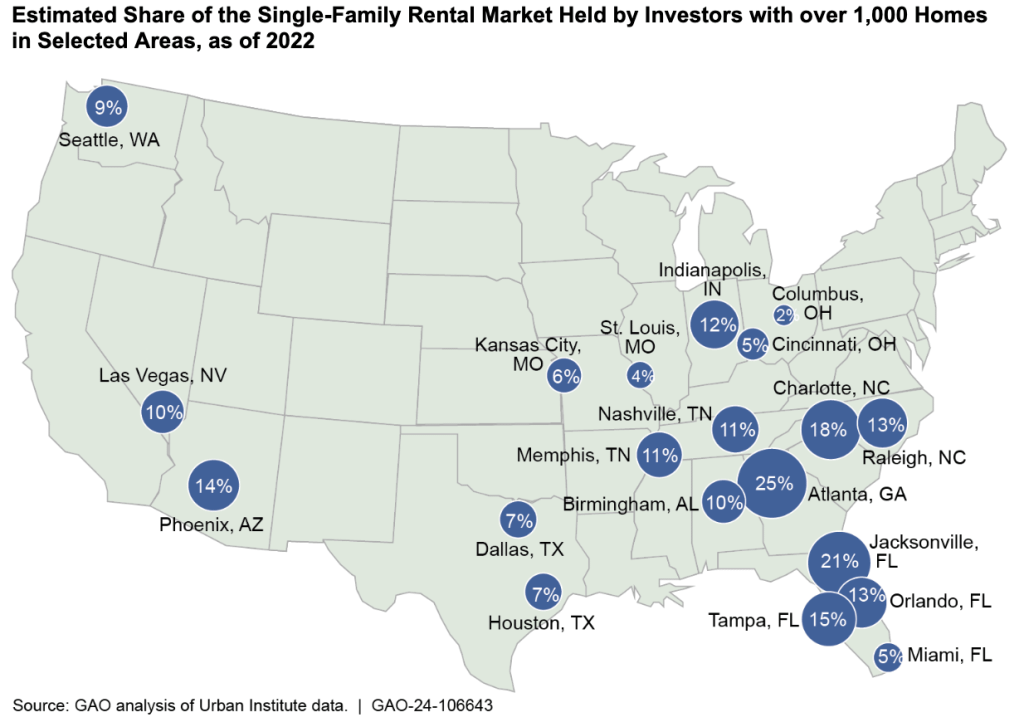
• The map by GAO below shows the hot spots that the mega investors in the single-family rental market are moving in on. Whereas the percentage across the country only equates to 2%, when isolating individual areas, one can see that number climb quickly.
• According to MetLife Investment Management, they believe that institutional investors could control 40% of the U.S. single-family rental home market by 2030. That would be an incredible increase from 800,000 homes, if they are referring to “institutional investors” as owning 100+ homes.
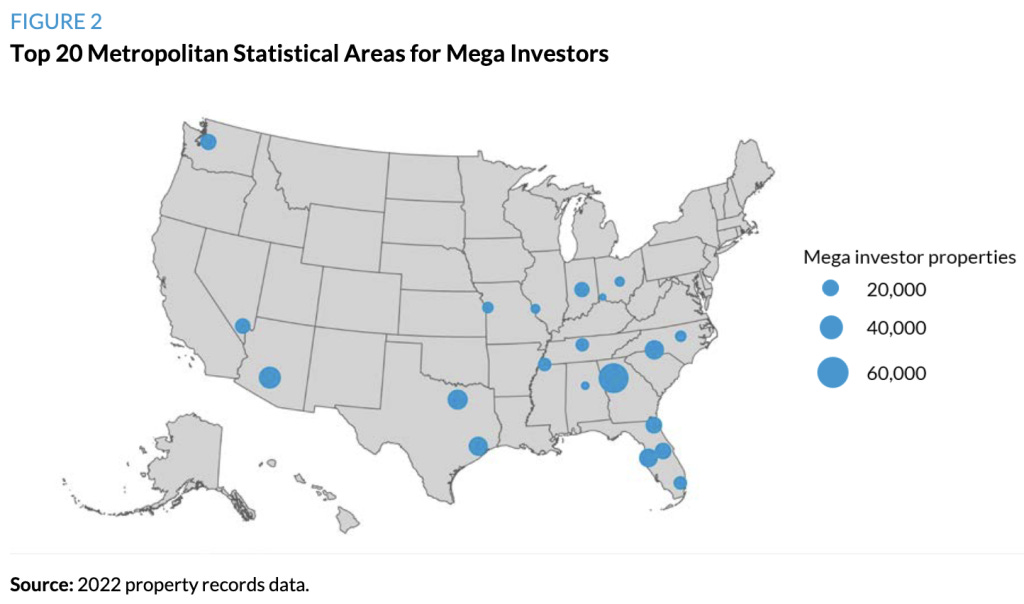
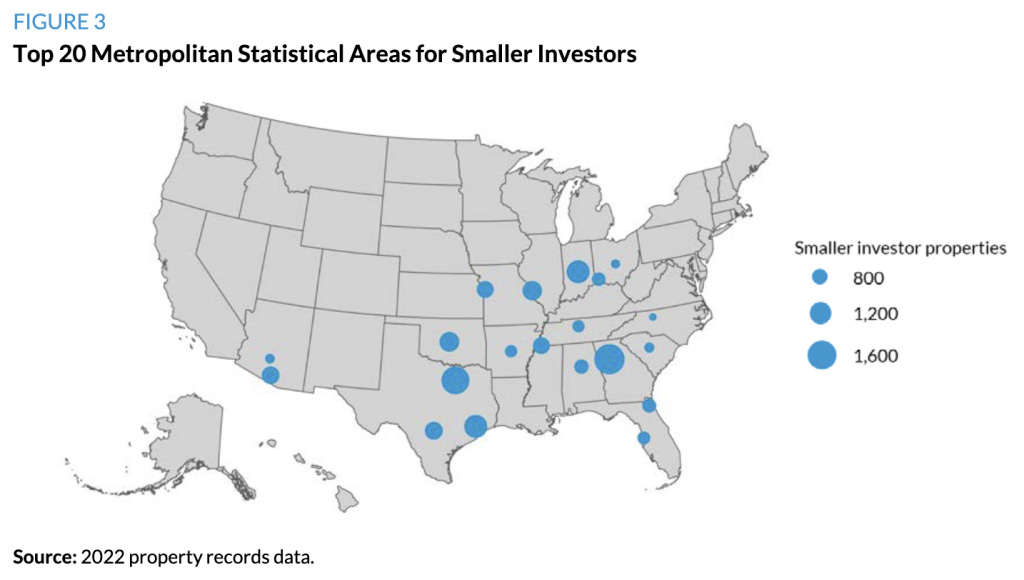
• The Urban Institute shows the top 20 locations where mega investors hold single-family rental homes versus where the smaller investors dominate, and several areas tend to overlap. These maps are based on 2022 records, but it’s pretty safe to bet that the locations are still prime for them.
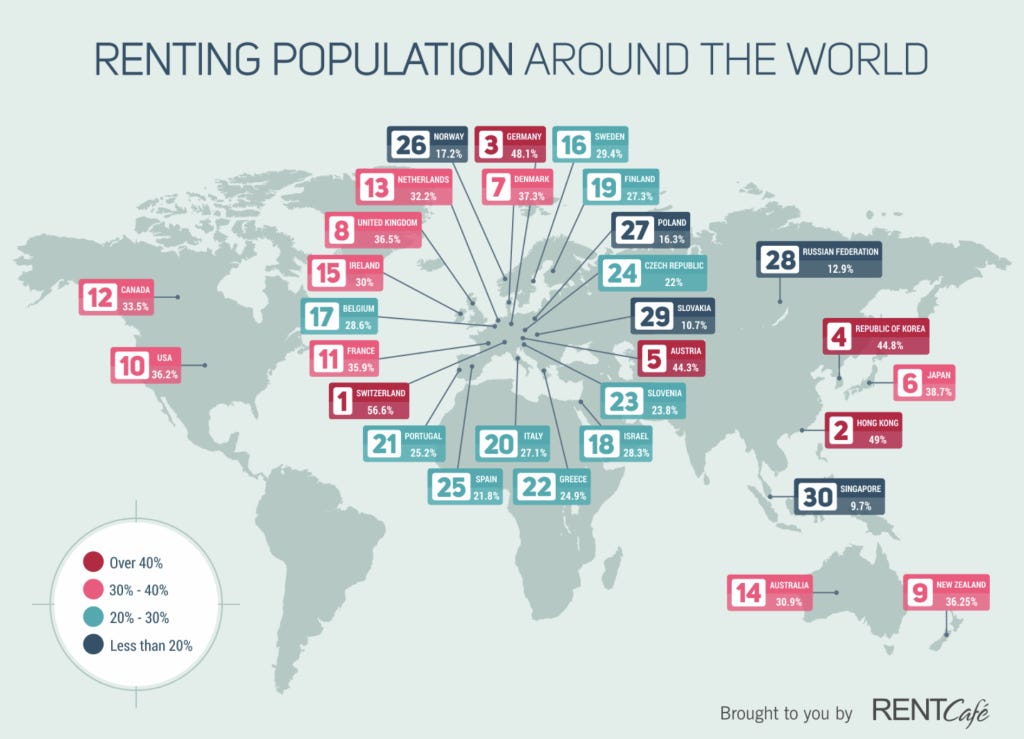
• In a 2018 international study, RentCafe analyzed 30 countries to determine the share of owning vs renting. They discovered that in 29 out of 30 countries the majority were homeowners, with exception of Switzerland where more than half of the population rents. This is a great map they put together, covering 30 countries, to show where the renting vs owning market stood back in 2018.
In 2018, 36.2% of Americans rented vs owned. As of April 2024, the rental rate dropped slightly to 34.4%.
In 2023, 2.5 million households moved to a single-family rental home, meaning they either moved from a multifamily unit, were first-time renters, or sold their homes and opted to rent a home. In a survey conducted by the U.S. Census Bureau, 14.3% stated they made the move because they wanted new or better housing, while 13.2% said it was for a job transfer and 10.9% wanted cheaper housing.
Since the percentage of renters actually dropped over the past six years, that survey would indicate that the market is likely shifting from multifamily to single-family rentals.
• Rent prices are increasing faster than home prices in two-thirds of the country, with an average investment return of 7.55% in 2024. Rents are also rising faster than wages in the majority of 341 counties that were analyzed by ATTOM. The interactive map created by ATTOM shows single-family rental returns in each of these counties, with some areas hitting in the teens.
Ownership Recap of Single-Family Homes:
• Investors own and rent 14.3 million single-family attached and detached homes
• Investors account for 14.4% of all single-family homes or 9.9% of all housing units in the U.S.
• Investors (including second-home buyers) are purchasing 25% of all homes sold
• Mom-and-Pops are leading the way (1-9 homes) – 18%
• Mid-Size Investors (10-99 homes) – 5%
• Big Institutional Investors (100+ homes) – 2%
• Big Institutional Investors currently own roughly 800,000 single-family rental homes
The Top 6 Companies That Own Single-Family Rental Homes In The U.S.
Keep reading with a 7-day free trial
Subscribe to RevealedEye to keep reading this post and get 7 days of free access to the full post archives.